July 6, 2026
OSHA Leading Indicators
OSHA leading indicators help you measure whether your safety efforts are preventing harm before an injury, illness, or fatal event occurs. Instead of waiting for incident rates to tell you something went wrong, leading indicators show whether critical actions, behaviors, and controls are happening as intended. That makes them especially useful for organizations that want a more proactive safety strategy and stronger prevention of serious injuries and fatalities.
If you are searching for OSHA leading indicators, you are usually trying to answer three practical questions: what they are, how they differ from lagging indicators, and which metrics are actually worth tracking. The most effective approach is not to collect more data for its own sake, but to choose a small set of indicators tied to real operational risk, leadership action, and workforce participation.
What is a Leading Indicator for OSHA?
A leading indicator is a proactive, preventive measure that helps gauge whether your safety and health program is performing effectively before an incident happens. It focuses on the activities, conditions, and behaviors that influence future outcomes. In simple terms, a leading indicator tells you whether your organization is doing the right things now to reduce risk later.
Common examples often include proactive safety activities such as timely hazard remediation, safety inspections or observations, response time for hazard reports, and other measures tied to how well preventive actions are carried out. These metrics are useful because they are actionable. If performance drops, you can intervene immediately rather than reviewing the damage after the fact.
OSHA encourages employers to use proactive measures because lagging data alone cannot prevent the next event. A strong leading indicator program helps you identify weak controls, improve accountability, and focus attention where risk is building.
OSHA Leading and Lagging Indicators: What is the Difference?
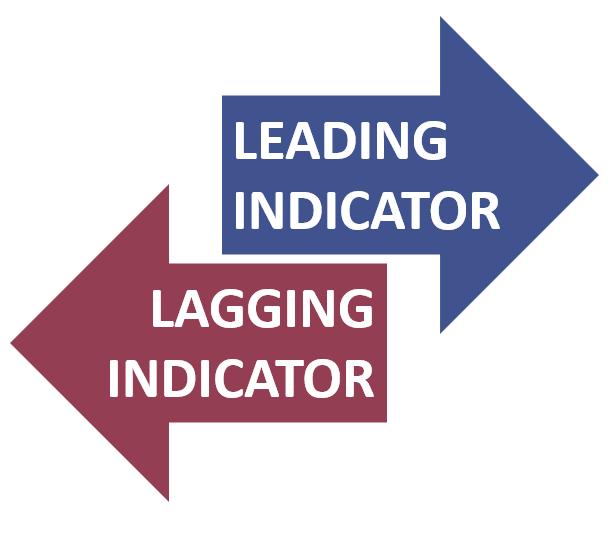
The difference between OSHA leading and lagging indicators comes down to timing and purpose. Leading indicators are forward-looking. They measure whether preventive actions are being completed and whether safety systems are functioning. Lagging indicators are backward-looking. They measure outcomes that have already happened, such as injuries, illnesses, recordable incidents, lost time cases, or fatalities.
For example, if you track how often supervisors complete meaningful field safety interactions, that is a leading indicator. If you track the number of recordable injuries from the past quarter, that is a lagging indicator. One helps you influence what happens next. The other tells you what has already happened.
That does not mean lagging indicators are unimportant. They still matter because they show trend lines and outcome severity. But relying on lagging indicators alone often creates a reactive safety model. By the time the number moves in the wrong direction, people may already have been harmed.
The best safety systems use both. OSHA lagging indicators help confirm results, while leading indicators help you manage exposure, verify execution, and improve decision-making before a serious event occurs.
Why OSHA Leading Indicators Matter in a Safety Program
Leading indicators matter because they shift your safety process from response to prevention. They give you visibility into whether critical work is being planned, whether hazards are being addressed, whether leaders are reinforcing expectations, and whether workers are actively engaged in risk reduction.
Used well, they can help you:
- Identify weak points in your safety management system earlier
- Reduce the likelihood of serious injuries and fatalities
- Improve hazard recognition and corrective action follow-through
- Increase worker participation in safety processes
- Support better operational consistency across teams and sites
- Prioritize resources around the highest-risk activities
This is particularly important in high-risk industries where low-frequency, but high-consequence events can occur even when traditional injury rates appear stable. A company can have decent lagging results and still be exposed to serious risk if critical controls are unreliable, leadership visibility is weak, or learning loops are broken.
Examples of OSHA Leading Indicators
If you are asking, “What are examples of leading indicators?” the answer depends on the risks in your environment. The strongest indicators are tied to the work that could lead to serious outcomes, not just easy-to-count activities. That means quality matters as much as quantity.
Leadership and Engagement Indicators
- Percentage of planned leader field engagements completed
- Quality score of safety conversations during site visits
- Frequency of discussions about serious injury and fatality exposure
- Percentage of supervisors trained on risk-based decision-making
Hazard Identification and Response Indicators
- Number of hazards reported by workers
- Average time to close corrective actions
- Percentage of high-risk findings escalated within target time
- Percentage of recurring hazards eliminated at the source
Planning and Operational Control Indicators
- Completion rate of pre-task risk assessments
- Quality of job planning for non-routine work
- Verification of critical controls before high-risk tasks begin
- Percentage of permit-required work reviewed by competent personnel
Learning and Capability Indicators
- Participation in targeted safety training
- Demonstrated competence after training, not just attendance
- Percentage of incident learnings shared across similar operations
- Completion of coaching actions after observations or audits
Culture and Participation Indicators
- Worker involvement in safety committees or improvement teams
- Response rate to safety culture surveys
- Frequency of stop-work interventions when risk is unclear
- Percentage of employees who believe concerns can be raised without consequences
Which of the Following is an OSHA Leading Indicator?
A leading indicator is any measurable activity or condition that helps predict and prevent a future safety event. So if you are choosing between a result that already happened and an action that reduces risk before harm, the preventive action is the leading indicator.
Examples of leading indicators:
- Completion of daily high-risk work reviews
- Timely closure of open hazard reports
- Percentage of employees participating in safety observations
- Verification that critical controls are in place before work starts
Examples of lagging indicators:
- Total recordable incident rate
- Days away, restricted, or transferred cases
- Number of lost time injuries
- Number of fatalities
A simple test: if the metric gives you a chance to intervene before someone gets hurt, it is likely a leading indicator. If it records the outcome after harm or loss, it is a lagging indicator.
How to Choose the Right OSHA Leading Indicators
Not every safety metric is useful. Some organizations track what is easy instead of what is meaningful. The right OSHA leading indicators should be directly connected to your highest-risk exposures and to the controls that prevent serious outcomes.
Start with Serious Risk, Not Generic Activity
Begin by identifying tasks and situations with the greatest potential for severe injury or fatality. Indicators should monitor whether the controls for those exposures are defined, understood, verified, and consistently applied.
Measure Actions You Can Influence
The best indicators point to something a team can improve quickly. If a metric goes off track, there should be a clear response. This makes the data operational instead of decorative.
Focus on Quality Over Volume
Counting activities can be misleading if the activity itself is weak. For example, counting the number of safety observations is less useful than measuring whether those observations identify critical risk and lead to real corrective action.
Stay Focused
A short set of meaningful metrics is usually more effective than a long dashboard. Too many indicators can dilute attention and create reporting fatigue.
Practical Framework for Using Leading Indicators
A practical way to use leading indicators is to move through four steps: identify, measure, review, and act.
1. Identify the Exposure
Determine where the organization faces the greatest potential for serious harm. This may include line of fire hazards, energy isolation, confined space entry, mobile equipment interaction, falls, contractor interfaces, or non-routine maintenance work.
2. Define the Critical Controls
For each exposure, clarify which controls must be present. Controls may include engineering safeguards, pre-job planning, permit processes, supervision requirements, competency checks, or verification steps.
3. Build Indicators Around Control Reliability
Track whether those controls are actually being executed. That is more useful than tracking broad participation alone. For example, measure whether isolation verification occurred before maintenance, not just whether a form was submitted.
4. Review Trends and Intervene Quickly
Leading indicators only work if they trigger action. Review results regularly, investigate weak signals, remove barriers, and hold leaders accountable for improving the system.
Examples of Strong vs. Weak Leading Indicators
| Weak Indicator | Why It Is Limited | Stronger Indicator |
| Number of safety meetings held | Measures activity, not effectiveness | Percentage of meeting actions closed on time for high-risk issues |
| Training attendance | Attendance does not prove competence | Percentage of workers who demonstrate competence in critical tasks |
| Number of audits completed | Volume alone may not reduce risk | Rate of critical audit findings corrected within target time |
| Hazards reported | Count alone lacks context | Percentage of serious hazards controlled or eliminated promptly |
| Supervisor site visits | Presence does not equal impact | Quality of leader engagements focused on serious risk exposure |
Using Leading Indicators to Strengthen SIF Prevention
For many organizations, the real value of leading indicators is not general safety activity but prevention of serious injuries and fatalities. That requires a tighter connection between metrics and exposure to catastrophic outcomes. A company can have solid injury statistics while still carrying unmanaged fatality risk. That is why leading indicators for SIF prevention are different from broad administrative metrics.
Useful SIF-related indicators often measure whether leaders and teams are identifying high-energy hazards, verifying critical controls, escalating deviations, and learning from near misses with serious potential. Examples include the percentage of high-risk tasks with verified controls, closure of SIF-potential corrective actions, quality of field verification in critical operations, and decision-making discipline when production pressure conflicts with safe execution.
Organizations that want a stronger approach often benefit from structured assessments of leadership behavior and safety culture. Tools such as a safety leadership assessment or a safety culture survey can reveal whether the system supports proactive risk reduction or quietly tolerates drift in high-risk work.
Common Mistakes When Tracking OSHA Leading Indicators
- Tracking too many metrics at once
- Choosing indicators that are easy to report but weakly tied to risk
- Measuring completion without checking quality
- Failing to separate serious risk from lower-consequence issues
- Reviewing data without assigning follow-up action
- Treating leading indicators as compliance paperwork instead of decision support
When these mistakes happen, dashboards can look busy while serious exposure remains unchanged. A better approach is to choose a focused set of metrics that help leaders make better operational decisions.
FAQs About OSHA Leading Indicators
Build a More Proactive Safety Strategy
If you want better results from OSHA leading indicators, focus on measures that reflect real exposure, real control reliability, and real leadership behavior. The goal is not just to report activity. The goal is to create earlier visibility, better decisions, and stronger prevention where the stakes are highest. For organizations looking to improve SIF prevention, leadership effectiveness, and safety culture, a more targeted indicator strategy can become a practical foundation for long-term performance improvement.
Learn more about our customized safety solutions.
* Developed with the support of AI and reviewed by Krause Bell Group Editorial Team