June 16, 2025
From Reactive to Proactive: The Power of Dashboards for Serious Injury and Fatality (SIF) Prevention.
In today’s fast-paced industrial landscape, safety management too often relies on lagging indicators—metrics that tell us what went wrong after an incident has occurred. While important, this focus is not particularly good at preventing the next serious injury or fatality. What if your safety management system could shift the focus from reacting to incidents to effective proactive prevention?
This is where SIF prevention dashboards come into play. A well-crafted SIF prevention dashboard is more than just a collection of data points; it is a dynamic tool that aligns organizational efforts to uncover and address the precursors of potential incidents before they result in actual incidents. By tracking exposure elements unique to your operations, you can identify the risks that matter most and take deliberate, measurable action to mitigate them.
What Makes a SIF Prevention Dashboard Effective?
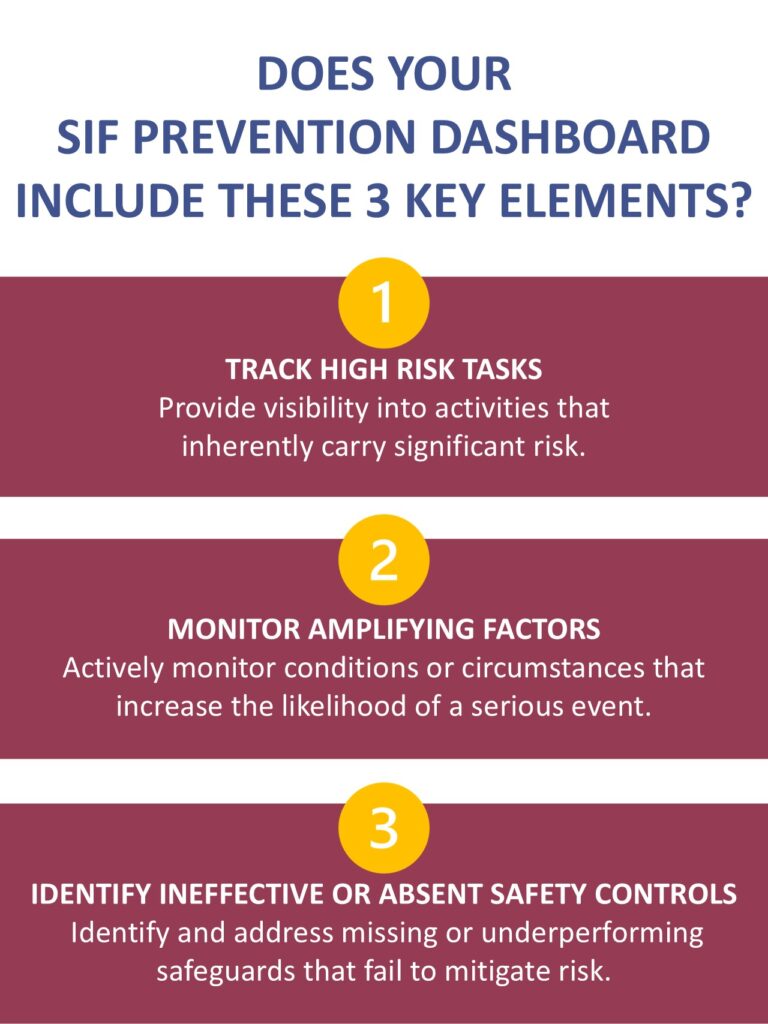
A strong SIF prevention dashboard provides visibility of three key elements that are predictive of SIFs:
- High-Risk Tasks: Activities that inherently carry significant risk.
- Amplifying Factors: Conditions or circumstances that increase the likelihood of a serious event.
- Ineffective or Absent Safety Controls: Missing or underperforming safeguards that fail to mitigate risk.
Tracking these elements provides a clearer picture of exposure, enabling leaders to prioritize resources and interventions where they will have the greatest impact, but an ideal dashboard goes beyond tracking. It should also integrate the following elements:
- Monitor the Frequency and Power of SIF Exposure: Provide visibility into how often high-risk tasks and their associated precursors are observed and assessed for SIF potential. Be aware that there can be a hidden compounding effect when multiple precursor elements are present at the same time, including multiples of each of the precursor elements.
- Highlighting Upstream Activities: Actively monitor, review, and discuss field engagements that have SIF Potential (SIFp). Track trends and learnings of effective listening, robust data gathering, and fresh perspectives gathered in these discussions.
- Celebrating Progress: Showcase successes, including attaining target numbers of discussions and completed action plans. Also highlight any success stories to reinforce a culture of proactive safety management.
A Healthy Paradigm Shift
Organizations often judge themselves on how swiftly they react to incidents, but focusing on exposure metrics challenges the conventional paradigm, shifting the narrative from “what happened” to “what could happen.” This forward-thinking approach cultivates a culture of anticipation and prevention, empowering leaders to take ownership of their safety processes.
The key is not to collect data for data’s sake, but to integrate it into a living, breathing safety management system. Dashboards designed with intent and precision become a guiding compass, fostering accountability and continuous improvement.
Driving Change Through Data
With decades of experience in safety performance consulting, I have witnessed firsthand how exposure-driven dashboards transform safety outcomes. By adopting a structured yet tailored approach, organizations can turn data into actionable insights, driving not only system improvements, but also a deeper commitment to safety at every level.
A good example comes from an arboriculture (tree care) organization that operates a variety of powered equipment and tools in high-risk environments, such as working at heights and in public traffic areas. After collecting data from field discussions about SIF potential for several weeks, their SIF prevention dashboard revealed critical insights that were invisible in their traditional safety reporting. While they had a high volume of high-risk tasks, such as working in hydraulic lifts, operating overhead cranes, and using powered hand tools in traffic, the dashboard also highlighted amplifying factors like crowded workspaces, unfamiliar team members, limited supervision, and pressure to complete tasks quickly.
Most notably, the dashboard pointed out a surprising control failure: the frequent non-use of specialized walkie-talkie hardhats, which crews relied on for critical safety communications when working in noisy environments, where crew members were physically too far apart to hear one another, or where vision was obscured and they could not see hand signals. This insight prompted further investigation into why this critical safety control wasn’t being used, leading to changes in expectations and practices regarding their use. As a result, the organization was able to effectively prevent potential SIF events by addressing a simple, but crucial, oversight.
Rethinking Safety: Use Dashboards for SIF Prevention
Are you ready to redefine how your organization thinks about safety? If so, you can leverage the power of a SIF prevention dashboard and put yourself and your organization on a new path that does more than inform about past results. A well-designed SIF prevention dashboard enables and inspires performance by driving focus upstream on what it takes to truly prevent SIFs.
Krause Bell Group works with organizations to design and implement SIF prevention systems, including dashboards that are tailored to address unique risks and operational needs. For more information about how we can help support your safety goals, request a consultation
