June 24, 2026
Leading and Lagging Indicators for Safety Culture
If you want to improve safety culture, you need more than injury statistics. Lagging indicators tell you what has already gone wrong. Leading indicators show whether the conditions, behaviors, and controls that prevent harm are actually in place. Used together, they give you a more reliable view of risk, performance, and culture than either one can provide alone.
For safety leaders, the real value is not in collecting more metrics for the sake of reporting. It is in choosing indicators that help you see whether leadership actions, worker engagement, learning systems, and critical safeguards are reducing exposure before a serious event happens. That is especially important when your goal is not only compliance, but a stronger safety culture and better prevention of serious injuries and fatalities.
Why Both Leading and Lagging Indicators Matter in Safety Culture
Leading and lagging indicators measure different parts of safety performance. Lagging indicators look backward. They track outcomes that have already occurred, such as injuries, illnesses, recordables, lost time incidents, or serious injuries and fatalities. These metrics are useful because they show results, support compliance reporting, and help you benchmark performance over time.
Leading indicators look forward. They track the activities, conditions, and behaviors that influence whether incidents are more or less likely to happen. Examples include the quality of hazard identification, closure rate of corrective actions, verification of critical controls, leadership visibility, training completion, and employee participation in reporting and learning.
If you rely only on lagging indicators, you are waiting for failure to reveal weakness. If you rely only on leading indicators, you may miss whether your efforts are actually improving outcomes. A healthy measurement system uses both. Leading indicators help you manage risk proactively, while lagging indicators confirm whether your systems are delivering safer results.
What is a Leading Indicator in Safety?
A leading indicator in safety is a measure that gives you insight into whether your organization is doing the things that prevent incidents. It is proactive rather than reactive. Instead of counting injuries after the fact, it tracks whether safety-critical actions are happening consistently and effectively.
Good leading indicators are tied to risk, not just activity volume. For example, counting the number of safety observations may sound useful, but it becomes far more valuable when you also measure the quality of those observations, whether meaningful issues are identified, and whether actions are closed on time. In other words, a leading indicator should help you understand whether your safety culture is becoming more aware, more responsive, and more disciplined in preventing exposure.
For safety culture specifically, leading indicators often reflect how people lead, communicate, learn, intervene, and follow through. They can show whether safety is embedded in day-to-day decisions rather than treated as a reporting requirement.
What is a Lagging Indicator in Safety?
A lagging indicator in safety is a measure of outcomes that have already happened. It tells you where harm, loss, or failure has occurred. Common lagging indicators include total recordable incident rate, lost time injury rate, severity rate, first aid cases, workers’ compensation claims, and serious injuries and fatalities.
These metrics still matter. They help you identify patterns, report performance, and understand the impact of your safety program. They can also highlight where your current controls or practices were not enough. But lagging indicators have a clear limitation: by the time they move, someone may already have been hurt, production may have been disrupted, or a serious exposure may already have occurred.
That is why lagging indicators should be treated as part of the picture, not the whole picture. In a strong safety culture, they are used to learn and improve, not as the only evidence that safety is under control.
Leading vs Lagging Indicators in Safety Culture
The difference between leading and lagging indicators is simple in theory but important in practice. Lagging indicators measure results. Leading indicators measure the drivers of those results. One tells you what happened. The other helps you understand what is likely to happen if current conditions continue.
In safety culture, this matters because culture is rarely visible in injury data alone. A low incident rate does not automatically mean you have a strong culture. It may mean luck, low reporting, low exposure, or a short time frame without a major event. On the other hand, strong leading indicators can reveal whether leaders are engaged, whether employees speak up, whether learning is happening, and whether critical controls are being maintained before a serious event occurs.
| Indicator Type | Focus | What It Tells You | Typical Examples |
| Leading indicators | Prevention and conditions | Whether risk controls, behaviors, and systems are working before harm occurs | Hazard reporting, action closure, training completion, safeguard verification, leadership engagement |
| Lagging indicators | Outcomes and events | What harm or loss has already occurred | TRIR, LTIR, DART, first aid cases, severity rate, serious injuries and fatalities |
Examples of Leading and Lagging Indicators for Safety Culture
One of the most common questions is: what are examples of leading and lagging indicators in safety? The answer depends on your risk profile, but the most useful indicators usually connect culture, leadership, and operational discipline.
Leading Indicator Examples
- Percentage of identified hazards closed by due date
- Quality and frequency of supervisor safety conversations
- Verification rate for critical safeguards and controls
- Near-miss reporting rate with follow-through on learning
- Completion and effectiveness of risk-based training
- Timeliness of corrective and preventive action closure
- Employee participation in inspections, learning teams, or procedure development
- Leadership visibility in the field and coaching quality
- Frequency of recurring known hazards
- Employee safety climate or culture survey scores used alongside other proactive measures
Lagging Indicator Examples
- Total recordable incident rate
- Lost time injury rate
- DART rate
- Severity rate
- First aid case rate
- Property damage incidents
- Occupational illness cases
- Serious injuries and fatalities
- Workers’ compensation costs
What are the Indicators of a Good Safety Culture?
A good safety culture is visible in what people do consistently, especially when production pressure, ambiguity, or competing priorities are present. The strongest indicators are not only low incident numbers, but also signs that the organization notices weak signals early and responds before exposure escalates.
In practice, indicators of a good safety culture often include open reporting, strong leadership credibility, timely follow-through, learning from weak signals, and visible accountability at every level. Employees are more likely to raise concerns, leaders are more likely to act on them, and the organization is less likely to normalize deviation.
- Employees report hazards and near misses without fear
- Leaders respond quickly and visibly to reported concerns
- Critical risk controls are consistently verified
- Corrective actions are completed on time and stay closed
- Safety discussions focus on exposure and learning, not blame
- Training builds competence, not just attendance records
- The same exposure does not keep recurring in different forms
- Senior leaders treat safety as a decision-making issue, not just a scorecard issue
How to Choose the Right Metrics for your Safety Culture
Not every safety metric is equally valuable. The best indicators are relevant to your actual risk, easy to define, and connected to decisions people can make. A metric should help you act, not just report. If it looks impressive on a dashboard but does not change behavior or resource allocation, it is probably not helping much.
Start by identifying the exposures that matter most. If your organization has serious injury and fatality risk, your leading indicators should focus on the controls, decisions, and leadership behaviors that influence those exposures. That may include verification of critical safeguards, quality of pre-job planning, closure of high-risk actions, or visibility into recurring hazard patterns. Then pair those with lagging indicators that confirm whether performance is improving over time.
A useful test is to ask three questions:
- Does this metric relate to a meaningful risk or cultural behavior?
- Can leaders and teams influence it through clear action?
- Will movement in this metric help us prevent harm, not just explain it later?
Common Mistakes when Using Safety Indicators
Many organizations track plenty of data but still struggle to improve safety culture. That usually happens because the measurement system is too reactive, too broad, or too disconnected from real exposure.
- Using lagging indicators as the main definition of safety success
- Tracking activity counts without checking quality or impact
- Choosing easy metrics instead of risk-relevant metrics
- Measuring compliance only, while ignoring leadership and culture signals
- Failing to separate high-consequence exposure from low-severity events
- Collecting data without reviewing trends, causes, and repeat patterns
- Not assigning ownership for action after indicators reveal a problem
For example, a high number of observations is not automatically positive if observations are superficial, repetitive, or disconnected from critical risk. In the same way, low injury rates may hide weak reporting, low trust, or unmanaged exposure. Good measurement requires interpretation, not just collection.
Building a Balanced Scorecard for Safety Culture
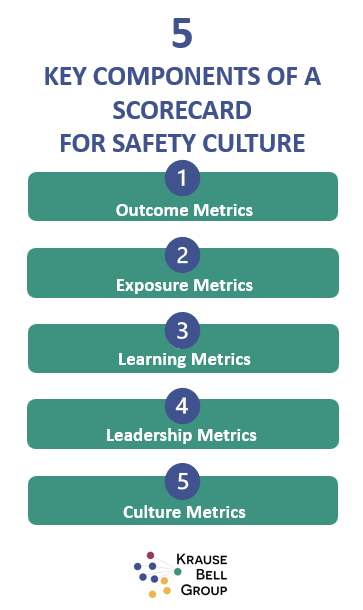
A practical way to use leading and lagging indicators for safety culture is to build a balanced scorecard. This means combining outcome metrics with prevention metrics so you can see both current performance and future risk.
Your scorecard should stay focused. A small set of well-chosen indicators is usually more effective than a long list of disconnected numbers. Include lagging indicators that show performance outcomes, but place strong emphasis on leading indicators that reflect leadership, learning, participation, and control effectiveness.
A Simple Structure You Can Use
- Outcome metrics – recordables, lost time cases, severity, serious injuries and fatalities
- Exposure metrics – recurring known hazards, critical control failures, unresolved high-risk findings
- Learning metrics – near-miss quality, learning distribution, investigation quality, action closure timeliness
- Leadership metrics – field engagement, coaching quality, response time to concerns, accountability follow-through
- Culture metrics – trust, speaking up, employee participation, culture survey trends used with other proactive measures
This kind of structure helps you move beyond basic compliance reporting and toward a more strategic view of safety culture. It also makes it easier for senior leaders to see where intervention is needed.
Using Indicators to Strengthen Prevention, Not Just Reporting
The strongest safety systems use indicators to support better conversations and better decisions. When a leading indicator shifts in the wrong direction, the goal is not only to update a dashboard. The goal is to understand what has changed in the field, in leadership attention, in operational pressure, or in control reliability.
That is why many organizations are moving toward more risk-sensitive measurement, especially around serious injury and fatality prevention. Instead of treating all incidents as equal, they look more closely at exposure potential, critical safeguards, and repeat patterns. This gives leaders a better chance to intervene before a severe event occurs.
For companies working to improve decision-making, leadership, and culture, indicators are most useful when they are connected to a broader operating system. Assessments, dashboards, leadership feedback, and culture surveys can all help turn raw metrics into insight and action.
FAQs About Leading and Lagging Indicators for Safety Culture
* Developed with the support of AI and reviewed by Krause Bell Group Editorial Team