August 29, 2022
What Every Executive Should Look for in a Safety Dashboard
Why Your Safety Dashboard Deserves Executive Attention

On the day of his retirement, the head of EHS at a large, global manufacturing company sent a note filled with advice for his friends and colleagues. This note summed up his decades-long experience. The first item on this list was “Stop the Spitting Contest,” or something to that effect. He wrote about a Vice President from his early career who had regular safety scorecard reviews with his CEO. Unfortunately, the exercise amounted to little more than a ‘spitting contest’ among the VPs, a contest nobody wanted to lose. A great deal of time and energy went into managing numbers in that company, time that everyone knew could have saved someone’s life, if it had been spent managing risk. Safety dashboard management remained his great frustrations over his long career.
This story illustrates how powerful an executive’s attention is, and how important it is to focus that attention in the right places. Your safety dashboard should inform questions like “Is our safety improvement strategy working? Are our efforts building culture or damaging it? Where is our SIF potential changing?
The problem is, very few dashboards contain the information you need and even if they do, most are so poorly designed you can’t see it.
This is a guide to developing a dashboard that help you focus on the things that will help your organization improve. It is written for CEOs, senior leaders, and your EHS partners. It will discuss what metrics you should have on your dashboard, how to display the information, and a few other considerations.
We encourage sr. leaders to sit down with your EHS partners. Using this white paper as your guide, have a discussion around:
- What metrics should we be tracking?
- How should the information be presented?
- What leadership capability is required to use the information well?
Lagging Indicators
Lagging indicators are an important part of your safety dashboard.
You’ve got to look at lagging indicators, there’s no way around it. A basic goal of any good organization is to prevent harm to its workers, and you’ve got to know in clear, unequivocal terms the extent to which that is happening.
We recommend tracking the recordable injury rate, not because it’s perfect, but because it is well-defined. That everybody has it is a bonus for those who want to benchmark, however variation in reporting systems and culture negates the value of benchmarking efforts.
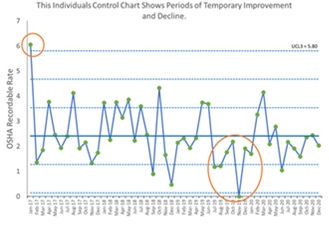
If you display your recordable injury rate longitudinally, in a statical process control chart, it will help you answer the question, “Are we getting better or worse over time?” This is the best display we know of.
If you have SIF exposure in your organization, it is vital that you look at the subset of actual serious and fatal injuries (SIF Actuals) separately. Most leaders find any kind of statistical presentation of these events to be objectionable. We recommend sharing information about actual SIF events in story format. Telling the stories will help people connect emotionally to what happened and contribute to organizational learning. Behind the scenes, your SIF events are an irreplaceable anchor for your leading indicators. The leading indicator must lead somewhere worthwhile, and nothing is more worthwhile than SIF prevention.
Lagging indicators do have limitations. No lagging indicator can provide insight into how to improve, or where leadership is required. They provide a false sense of security that the hazards in your workplaces are effectively managed. And study after study in the past 10 years have shown that just because you’ve driven recordable injuries to zero doesn’t mean you are well protected from SIFs.
Your safety dashboard will need two additional types of metrics: progress indicators and leading indicators.
Progress Indicators
Progress indicators support the implementation of your safety improvement strategy.
If you’ve got a safety improvement strategy, you need to monitor progress against it. Your safety dashboard should include a handful of progress indicators that help you hold your leaders accountable for executing that strategy with sufficient quality.
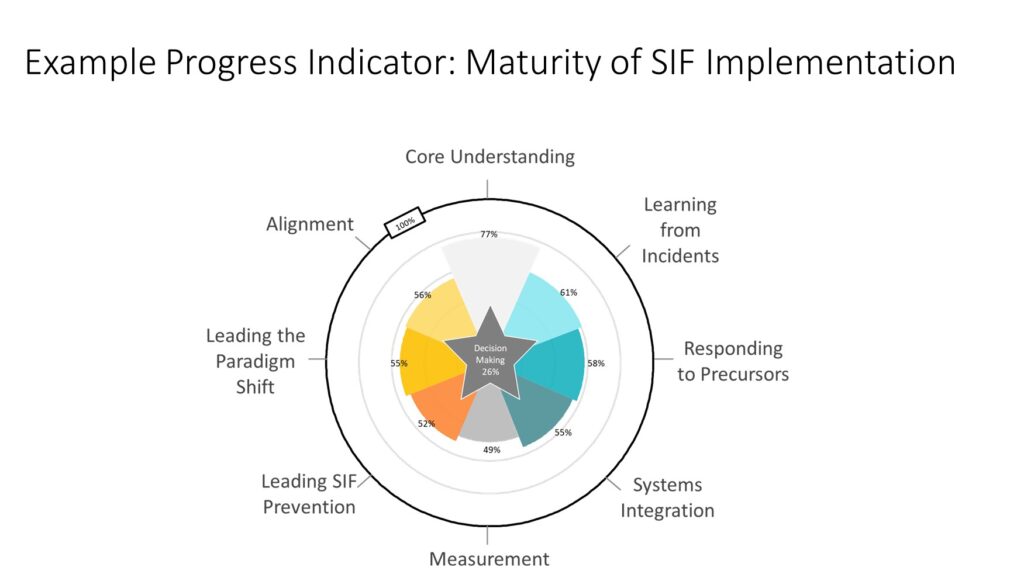
We recommend developing one or two measures of implementation progress that make visible the status and quality of implementation. Stay away from binary measures such as “complete or not complete” and measure the steps along a journey toward mastery. Define milestones that reflect increasing levels of capability in your organization. Some organizations choose to wrap a few different milestones in a single composite score. The composite score, or “index score”, represents increasing capability. Targets for goal-setting can be gradually increased over several years.
The problem with progress indicators is that they lack context. Even with the best attempts to emphasize quality and capability, two sites can report 90% achievement on a metric and be a million miles apart in terms of their capability to manage risk. Differences in leadership account for a huge portion of the variance. Local access to knowledge and EHS expertise are critical as well.
There are at least two solutions for a senior leader, and we recommend both. The first is that you and your leadership team make EHS site visits part of your standard work. There is an art to doing this, and method, but it is too big a topic to cover here. The second way is to add leading indicators to your scorecard.
Leading Indicators
True leading indicators separate sites that are struggling from those with good capability to manage risk.
Not every upstream measure is a leading indicator. A true leading indicator is a metric that predicts the outcome we are interested in. These are hard to come by – due to data availability and quality – but we have been able to help many organizations discover them. When leaders have good leading indicators to work with, the safety conversation naturally shifts from a reactive review of incidents to proactive leadership of safety improvements. And proactive leadership for safety is what saves lives.
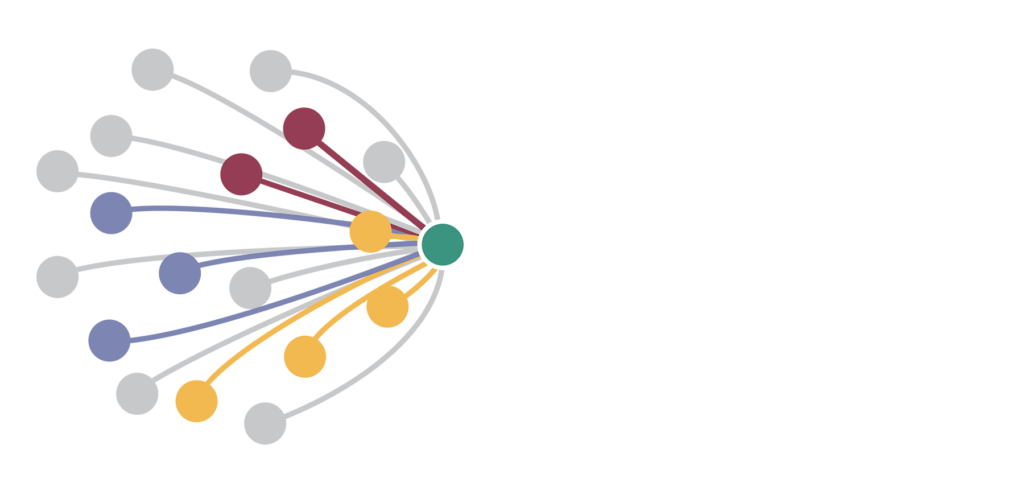
We recommend analyzing your data to discover your true leading indicators. The first place to look is in your organizational climate and culture, especially measures of the relationship between senior management and your people in the field. We also recommend developing leading indicators of serious and fatal injuries. SIF Potential can and should be measured, and if done well, it will provide you with an invaluable leading indicator. “SIF issues addressed” is predictive of safety improvement in many organizations.
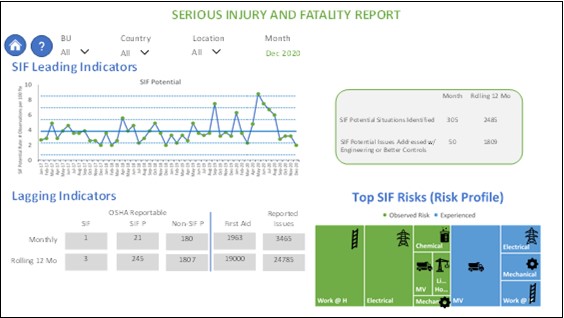
The best presentations of leading indicators are dynamic. A senior leader should be able to view the leading indicators in at least three ways – a snapshot in time, trends over time, and categorized. It should support filtering and sorting by time, risk category, and business unit.
Here’s a mock-up of an executive dashboard inspired by one of our clients whose safety improvement strategy is focused around SIF prevention. Notice that it includes verified leading indicators, lagging indicators, and progress indicators. It is a dynamic PowerBI report that has drill-down capability.
Taking Action
Your response to the data is more important than the dashboard itself.
The numbers should inform a conversation about safety, but all too often the numbers are the conversation.
When you look at control charts, and hear about SIF events, the first questions you should be asking should be all about the people affected, the impact on them, their families, and others. Your goal is to develop empathy — in yourself and in your team. This is the only way your value for people and their safety can reach through all the other good things that are competing for attention. Building on a foundation of empathy, you can dig into other important questions like – are we improving over time, are we seeing random variation or something else, and what more do we need to understand?
In our opening story, the mistake that our well-intended CEO made was that his value for human life didn’t get across to his Vice Presidents. His Vice Presidents interpreted his interest in the numbers as just interest in numbers. Critically, they underestimated their own impact on the culture and effectiveness of the EHS systems in their business units.
As you develop your EHS dashboard, consider how you will develop the strength of leadership required to take action based on it. Consider this: Until senior executives understand their true connection to the safety and health of the people working in their organization, your EHS dashboard will likely trigger an enormous amount of well-intended, but misguided, decision-making.