July 1, 2026
How to Implement Bowtie Analysis for SIF Risks
Bowtie analysis helps you turn serious injury and fatality risk into something your team can see, discuss, and manage. Instead of treating SIF exposure as a vague safety concern, a bow tie risk assessment shows the path from credible threats to a loss-of-control event and then to the consequences that matter most. For organizations focused on critical risk management and SIF prevention, this makes it easier to identify critical controls, spot weak barriers, and improve decision making where the stakes are highest.
What the Bow Tie Diagram Shows in a SIF Context
A bow tie diagram is a visual risk analysis tool built around one central event. On the left side, you map the threats that could cause a loss of control. On the right side, you map the consequences that could follow if that top event occurs. Between those threats and consequences, you place the barriers that are meant to prevent the event or reduce its impact.
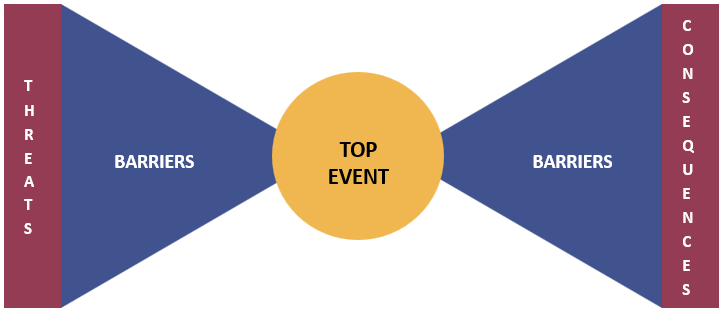
In a SIF context, the method is especially useful because it keeps the focus on high-consequence exposure, not just on frequent but low-severity incidents. It helps you answer practical questions such as:
- What hazard are you trying to control?
- What exactly is the top event?
- Which threats are credible for this work or operation?
- Which controls are truly critical for preventing a serious injury or fatality?
- What could weaken those controls in the real world?
If you have asked, “What is the bow tie diagram for risk analysis?” or “What is the bowtie risk analysis tool?”, the short answer is this: it is a structured way to connect hazards, threats, controls, escalation factors, and consequences in one view so you can manage critical risk more effectively.
Why Bowtie Analysis Works Well for SIF Risks
Serious injury and fatality risks usually sit inside a smaller set of high-energy, high-exposure scenarios. Those scenarios often involve line-of-fire hazards, mobile equipment, falls from height, suspended loads, confined spaces, uncontrolled releases, electrical contact, or process upsets. Traditional lagging metrics do not always reveal whether your organization is still exposed to those events.
Bowtie analysis is useful here because it forces a more disciplined conversation around exposure and control reliability. It helps you distinguish between general safety activity and the specific barriers that must work when a critical event begins to develop. That supports stronger prioritization, clearer ownership, and better field verification of critical controls.
It also fits naturally with a broader serious injury and fatality prevention approach that emphasizes defining SIF events, identifying critical work, understanding energy sources, and verifying whether controls are functioning in practice.
How to do a Bow Tie Risk Assessment for SIF Risks
If you want to know how to do a bow tie risk assessment, start by narrowing the scope. Bowtie analysis works best when each diagram is built around one clearly defined hazard and one credible top event. Trying to include too many scenarios in one model usually makes the analysis too generic to guide action.
1. Select the SIF Scenario you Need to Analyze
Begin with a scenario that has real SIF potential, not just general injury potential. Good candidates usually come from exposure analysis, prior incidents, high-risk tasks, process hazards, or leadership concern about weak controls. Focus on the situations where loss of control could realistically result in fatal or life-altering harm.
Examples of SIF-relevant scenarios include:
- Worker struck by mobile equipment
- Fall during elevated maintenance work
- Unexpected energization during servicing
- Loss of containment in a process environment
- Dropped object during lifting operations
2. Define the Hazard and the Top Event
The hazard is the source of potential harm. In SIF work, that is often a hazardous energy source, a high-risk condition, or an operational state with severe consequence potential. The top event is not the fatality itself. It is the moment control over the hazard is lost.
That distinction matters. A clear top event makes the whole bow tie analysis more useful.
| Element | Definition | SIF Example |
| Hazard | The source or condition with potential to cause serious harm | Stored electrical energy in energized equipment |
| Top Event | The point where control over the hazard is lost | Unexpected energization during maintenance |
| Consequence | The harmful outcome that may follow | Fatal shock, arc flash burn, secondary fall |
Keep the wording specific. “Human error” is rarely a useful top event. “Unexpected energization during maintenance” is much more actionable.
3. Identify Credible Threats on the Left Side of the Bow Tie
Threats are the causes that could lead to the top event. For SIF risk, this step should be grounded in actual work conditions, not generic labels. Use incident history, field observations, task analysis, equipment data, and input from supervisors and frontline workers.
For the example of unexpected energization, credible threats might include:
- Isolation points incorrectly identified
- Incomplete lockout procedure
- Contractor unfamiliar with the energy source
- Stored energy not released
- Remote restart capability overlooked
- Production pressure leading to shortcut behavior
This is where many teams improve the quality of the bow tie diagram by replacing vague causes with specific failure pathways that can actually be controlled.
4. Map Preventive Barriers that Should Stop the Top Event
Preventive barriers sit between each threat and the top event. Their job is to prevent the loss-of-control event from happening at all. In SIF bowtie analysis, these are often the controls you would recognize as critical controls.
Examples of preventive barriers include:
- Verified isolation and lockout-tagout process
- Equipment-specific energy isolation procedure
- Competency requirements for authorized workers
- Pre-job hazard review for non-routine work
- Try-start or zero-energy verification step
- Permit controls for energized work
Each barrier should be clear enough that you can later test whether it exists, whether it is used, and whether it is effective under real operating conditions.
5. Identify Consequences on the Right Side of the Bow Tie
Consequences are the outcomes that may occur after the top event. For SIF risks, keep the consequence statements tied to credible severe outcomes rather than broad labels. This improves the quality of mitigation planning.
Possible consequences for unexpected energization could include:
- Fatal electrical contact
- Arc flash injury
- Worker falls after sudden movement or shock
- Fire or equipment damage causing secondary exposure
When the consequences are concrete, it becomes easier to assess whether the right mitigative barriers are in place.
6. Add Mitigative Barriers that Reduce the Severity of Harm
Mitigative barriers are placed between the top event and the consequences. They do not prevent the event itself. Instead, they limit the harm once control has already been lost.
Depending on the scenario, mitigative barriers may include:
- Arc-rated PPE requirements
- Emergency shutdown systems
- Rescue readiness for elevated work
- Physical separation or guarding
- Emergency response procedures
- Rapid communication and medical escalation process
In a SIF framework, mitigative barriers still matter, but they should not distract from strengthening the controls most likely to prevent exposure in the first place.
7. Identify Escalation Factors and the Controls for those Factors
This is one of the most valuable parts of advanced bowtie analysis. An escalation factor is something that can make a barrier fail or weaken its effectiveness. If you skip this step, the diagram may look complete on paper while hiding the real conditions that create SIF exposure.
For example, if one preventive barrier is “lockout procedure followed,” escalation factors could include poor procedure design, missing isolation labels, weak contractor onboarding, poor shift handover, or supervisors tolerating deviations during production pressure.
You then add controls for those escalation factors, such as:
- Periodic procedure review and field validation
- Isolation point labeling standard
- Contractor qualification process
- Supervisor verification expectations
- Audit and corrective action routines
This is often the point where a bow tie risk assessment becomes far more operational and much more useful for leadership.
8. Decide Which Barriers are Critical for SIF Prevention
Not every barrier in a diagram has equal importance. For SIF risks, you should identify which barriers are truly critical. A critical barrier is one that plays a major role in preventing a serious injury or fatality or in reducing the severity of that outcome if prevention fails.
Use criteria such as:
- Does failure of this barrier materially increase SIF exposure?
- Is this one of the last lines of defense?
- Would leaders want assurance that this control is functioning every time?
- Can the barrier be defined in a way that allows verification?
This step aligns bowtie analysis with critical control management and helps prevent long diagrams filled with controls that are nice to have but not decisive.
9. Assign Ownership, Verification, and Performance Expectations
A bow tie diagram should never end as a workshop artifact. Once the barriers are mapped, you need to define who owns them, what good performance looks like, and how they will be checked. This is where implementation becomes practical.
For each critical barrier, define:
- Barrier owner
- Purpose of the barrier
- Minimum performance expectation
- How it will be verified in the field
- How often it will be reviewed
- What triggers corrective action
Without this step, teams may know what the controls are but still fail to monitor whether those controls are healthy in daily operations.
10. Validate the Bow Tie with the People Closest to the Work
One of the biggest reasons bowtie implementation fails is that diagrams are built by specialists alone and never pressure-tested in the field. Validation should include those who understand how work is actually done, where deviations occur, and which controls are trusted or bypassed.
A practical review group may include operations, maintenance, frontline supervisors, engineers, EHS leaders, and contractor representatives.
Ask simple questions:
- Are these threats realistic?
- Would these barriers really stop the event?
- Which barriers do we rely on most?
- Where are we most exposed today?
- What would fail under time pressure or abnormal conditions?
11. Use the Bow Tie to Drive Action, Not Just Documentation
The final step is turning the analysis into action. A bow tie diagram becomes valuable when it informs decisions about exposure reduction, leader focus, field verification, training, maintenance priorities, permit standards, and operational discipline.
Typical outputs include:
- A list of verified critical controls
- Barrier assurance activities
- Actions to close control gaps
- Targeted coaching for high-risk decisions
- Updates to procedures for critical work
- Leadership review of top SIF exposure scenarios
What are the 4 Steps of the Bowtie Assessment?
If you want the simplified version, the four core steps of the bowtie assessment are:
- Define the hazard and top event
- Identify threats and consequences
- Map preventive and mitigative barriers
- Review barrier weaknesses, ownership, and effectiveness
For SIF risks, that four-step model is useful as a starting point, but most organizations need the fuller implementation process above to make the analysis operational and reliable.
Example of a Bow Tie Risk Assessment for a SIF Scenario
Below is a simplified example for work at height during maintenance.
| Element | Example |
| Hazard | Elevated work location with fall exposure |
| Top Event | Loss of fall protection or loss of stable position at height |
| Threats | Improper anchor point, damaged lanyard, unstable surface, rushed task, inadequate planning |
| Preventive Barriers | Approved anchor points, pre-use inspection, competent person review, work-at-height permit, task planning |
| Escalation Factors | Weather change, poor lighting, contractor unfamiliarity, missing equipment, schedule pressure |
| Escalation Factor Controls | Weather stop-work criteria, lighting checks, contractor briefing, equipment readiness checks, supervisor authorization |
| Consequences | Fatal fall, traumatic injury, dropped objects injuring others |
| Mitigative Barriers | Rescue plan, trauma response capability, exclusion zones below work area |
This shows why bowtie analysis is effective for SIF risks: it makes the exposure pathway visible and clarifies where control quality matters most.
Common Mistakes when Implementing Bowtie Analysis for SIF Risks
- Using vague threats such as “human error” without identifying the actual failure mode
- Defining the top event as the final injury instead of the loss-of-control point
- Listing every control equally instead of distinguishing critical barriers
- Building diagrams in a workshop and never verifying them in the field
- Ignoring escalation factors that routinely weaken barriers
- Failing to assign barrier ownership and assurance routines
- Treating the bow tie as a one-time document rather than a living risk tool
If your organization is serious about SIF prevention, these are not small errors. They directly affect whether the bow tie analysis improves real risk management or just creates a neat picture.
How Bowtie Analysis Supports Critical Risk Management and SIF Prevention
Bowtie analysis is strongest when it is not used in isolation. It should support a wider process for identifying SIF exposure, defining critical work, clarifying critical controls, and improving the quality of decisions around high-risk operations.
For many organizations, that means connecting the bow tie to:
- SIF definitions and event criteria
- Exposure analysis for high-risk tasks and conditions
- Critical control verification in the field
- Leadership routines for reviewing major risk
- Learning from SIF precursors and weak signals
- Training that improves Safe Decision Making® principles in high-consequence work
This is also where many leaders see the real value. The diagram itself is useful, but the bigger gain comes from the discipline it creates around critical controls and exposure reduction.
When to Review and Update a Bow Tie Diagram
A bow tie diagram should be reviewed whenever the risk picture changes or when evidence suggests barriers may not be performing as expected.
Good review triggers include:
- A serious incident, near miss, or precursor event
- Changes in equipment, processes, or work methods
- New contractors or new workforce capability concerns
- Audit findings or failed control verifications
- Recurring deviations in critical work
- Major organizational or production changes
Even without a trigger event, periodic review is important. SIF risk often grows quietly through drift, normalization of deviation, or weakening discipline around barrier quality.
FAQs About Bowtie Analysis for SIF Risks
* Developed with the support of AI and reviewed by Krause Bell Group Editorial Team